Honest data. Better decisions.
No vanity metrics. The numbers that actually change how you schedule shifts, which zones you expand, and when you fire a campaign — in one place, exportable to CSV whenever you need them.
- Occupancy by zone, service, day, and slot
- No-show rate with segment breakdown
- Average lead time on bookings
- Source: widget, Google Reserve, chatbot, phone, manual
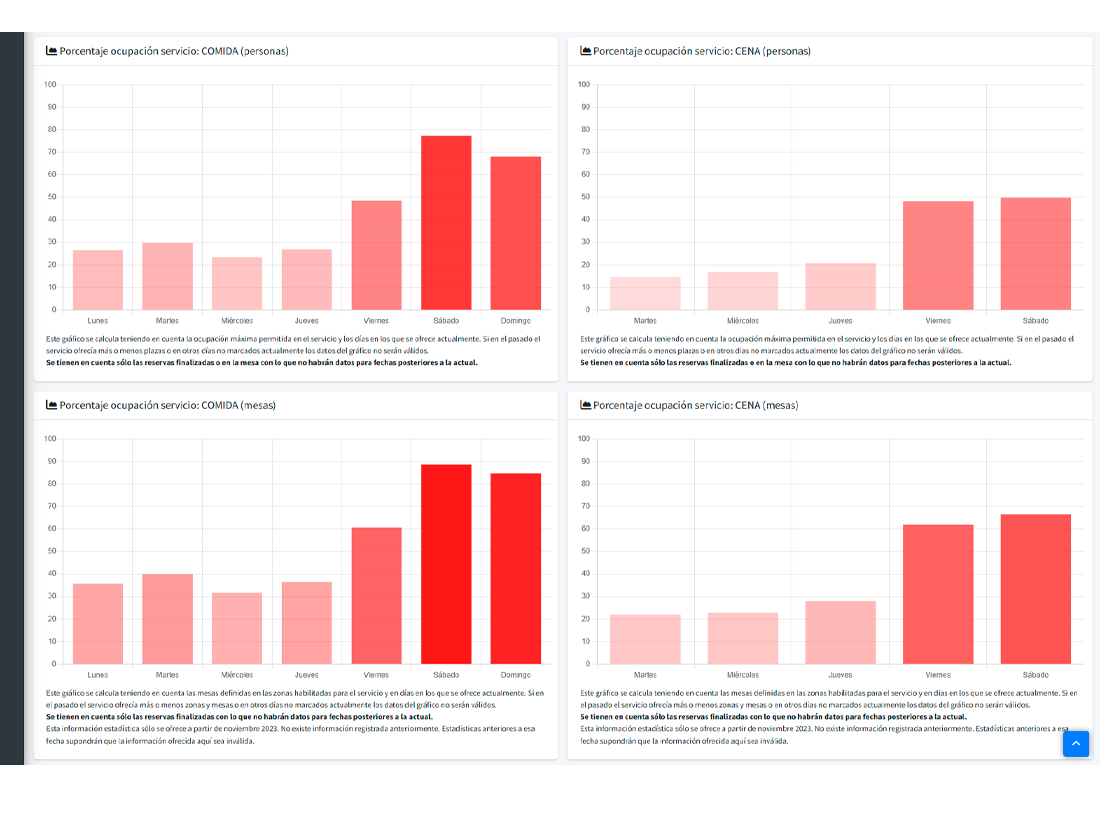
Where and when you fill up, where and when you miss.
Heatmap by zone, service, weekday, and hour. See at a glance that your terrace runs at 30% on Tuesdays and your indoor at 95% on Fridays. Re-schedule shifts accordingly. Or decide to expand the terrace in April.
- Per-zone occupancy (% of real capacity).
- Per-service (lunch vs dinner vs brunch).
- Day-by-hour heatmap.
- Comparisons with prior periods (month, quarter, year).
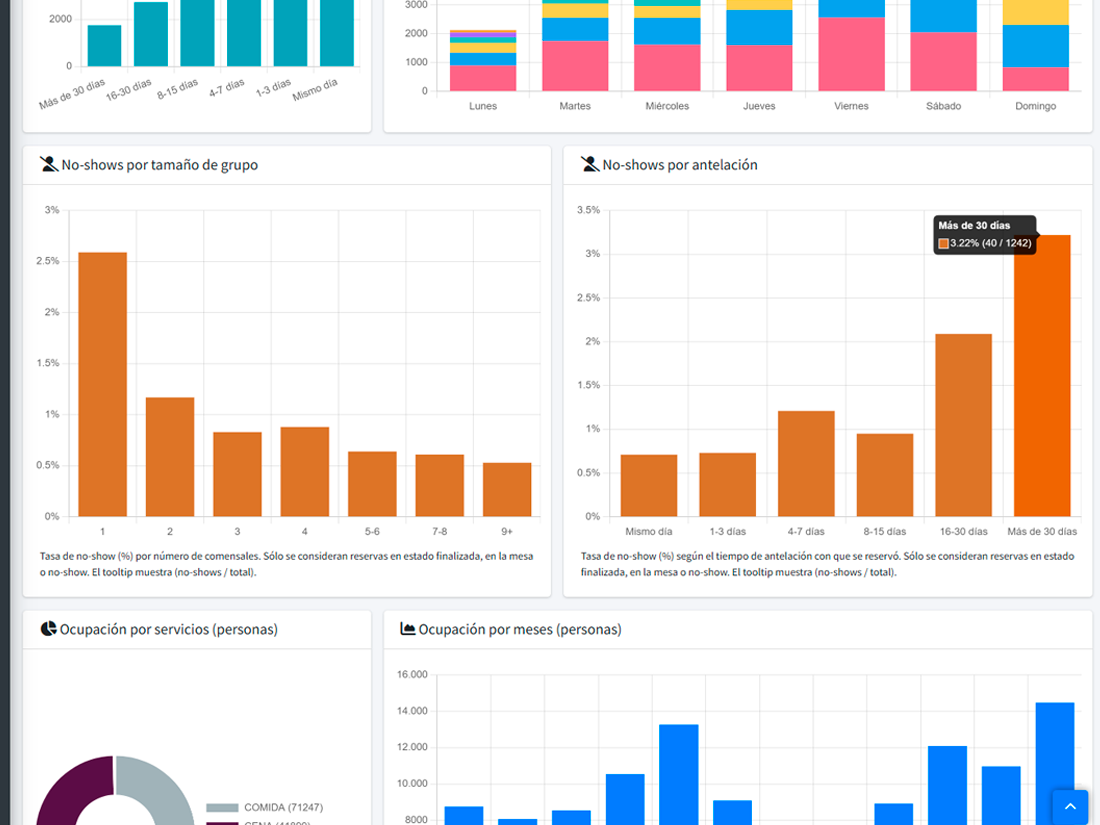
Know when and why they miss.
The global rate is one number; the useful breakdown is what matters. Reserver shows it by weekday, party size, source (walk-in vs widget), guest tag. Find out that 8+ parties no-show 35% of the time and turn on pre-auth only for them.
- Global and per-segment rates.
- Monthly and quarterly evolution.
- Optional anonymous benchmark against similar restaurants.
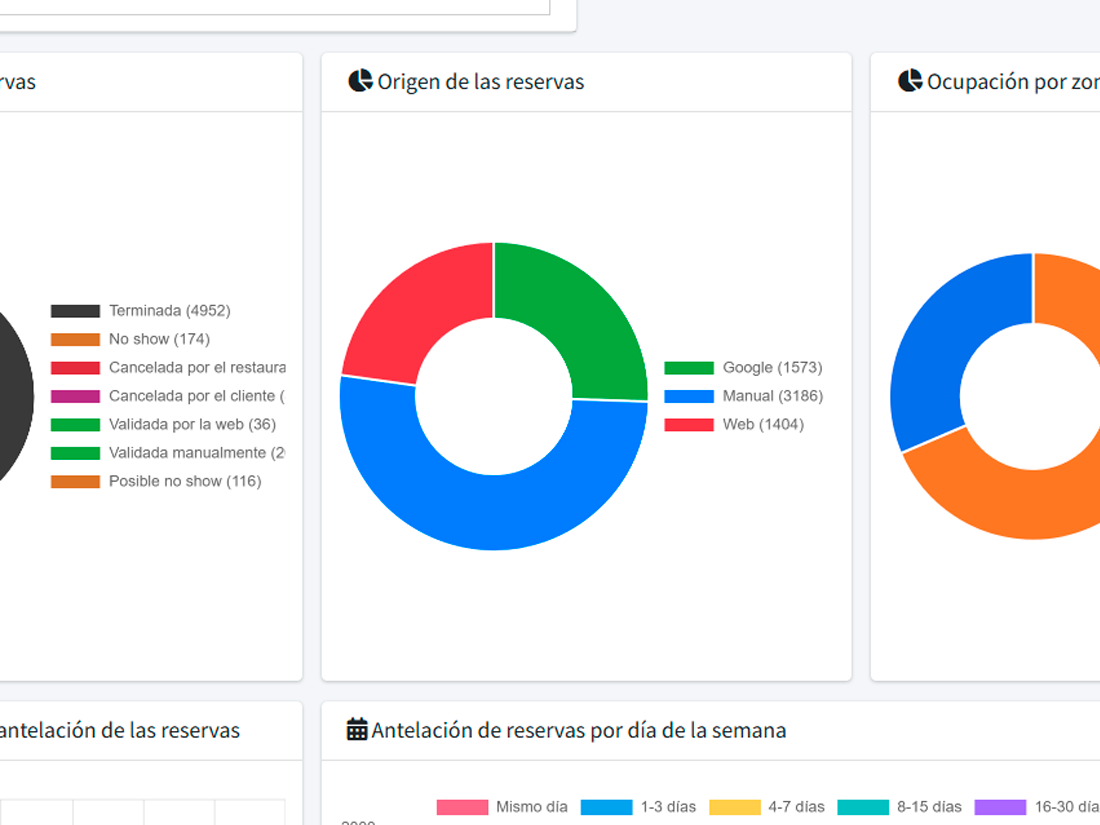
Know where each table comes from.
Every reservation is tagged with its source: your own widget, Reserve with Google, AI chatbot, voice AI, manual walk-in, marketing campaign. You see which channel brings most covers, which has best conversion, which is misbehaving.
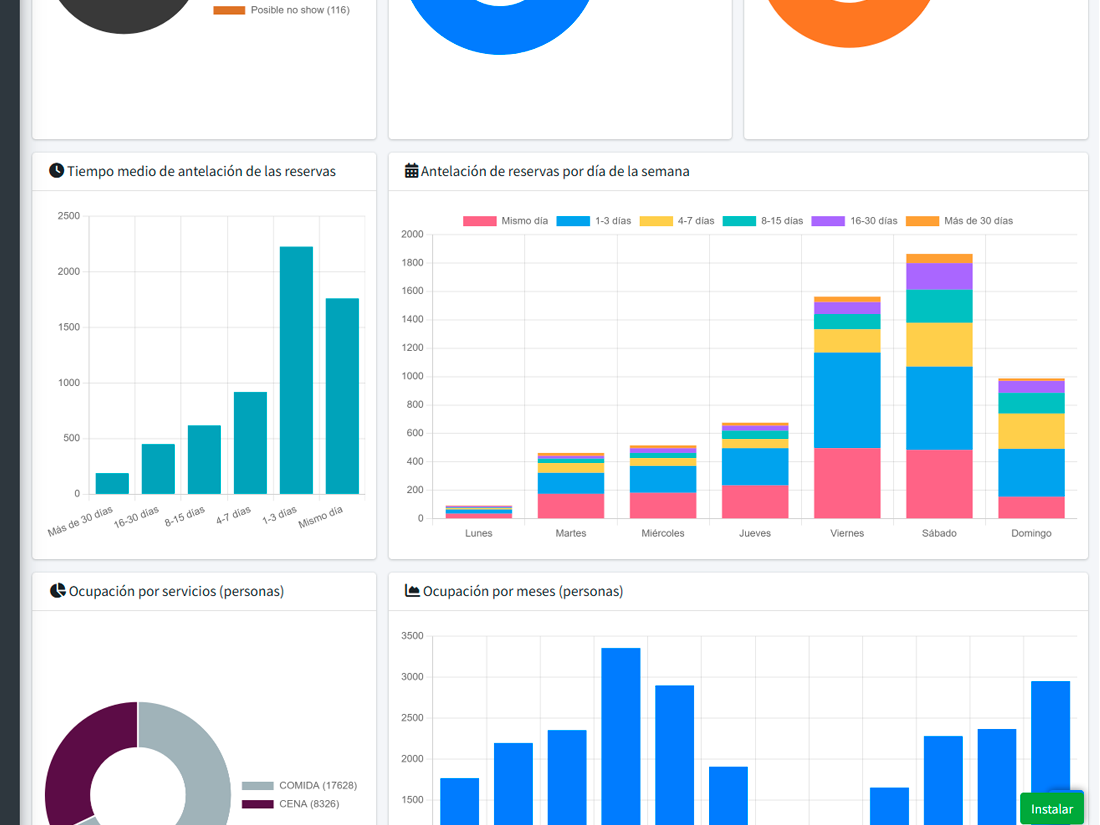
How far in advance your guests book.
The distribution of booking-to-service time reveals real behaviour. If the median is 2 days, your calendar should accept bookings two weeks ahead; if it’s 3 hours, three days is probably fine. Useful to decide when to close future booking windows.
What changes when you decide with data, not instinct
Better-calibrated shifts
Open or close services based on real demand, not what you did last year.
Surgical no-show policies
Apply pre-auth only to the segments that need it. Less friction for loyal guests.
Campaigns with verifiable ROI
You know which campaign generated which bookings. Double down on what works.
What people usually ask
Can I see real-time stats?
Can I compare to last year?
Can it integrate with my accounting or BI tool?
What happens to old data if I cancel?
Start making decisions with real data.
Enable reports and review your first metrics at the end of next month.